

🔸 Intro:
If you are doing intraday trading or thinking of starting it, then you must have heard the name of RSI indicator. RSI i.e. Relative Strength Index is a popular momentum indicator which tells whether a stock or index is in overbought or oversold condition or not.
But a big confusion often arises:
Should RSI be kept on 14-period or 9-period?
Meaning, RSI 14 vs RSI 9 – which one is more accurate and profitable for intraday trading?
Come, let us explain this confusion in detail in this post.
🔸 What is RSI?
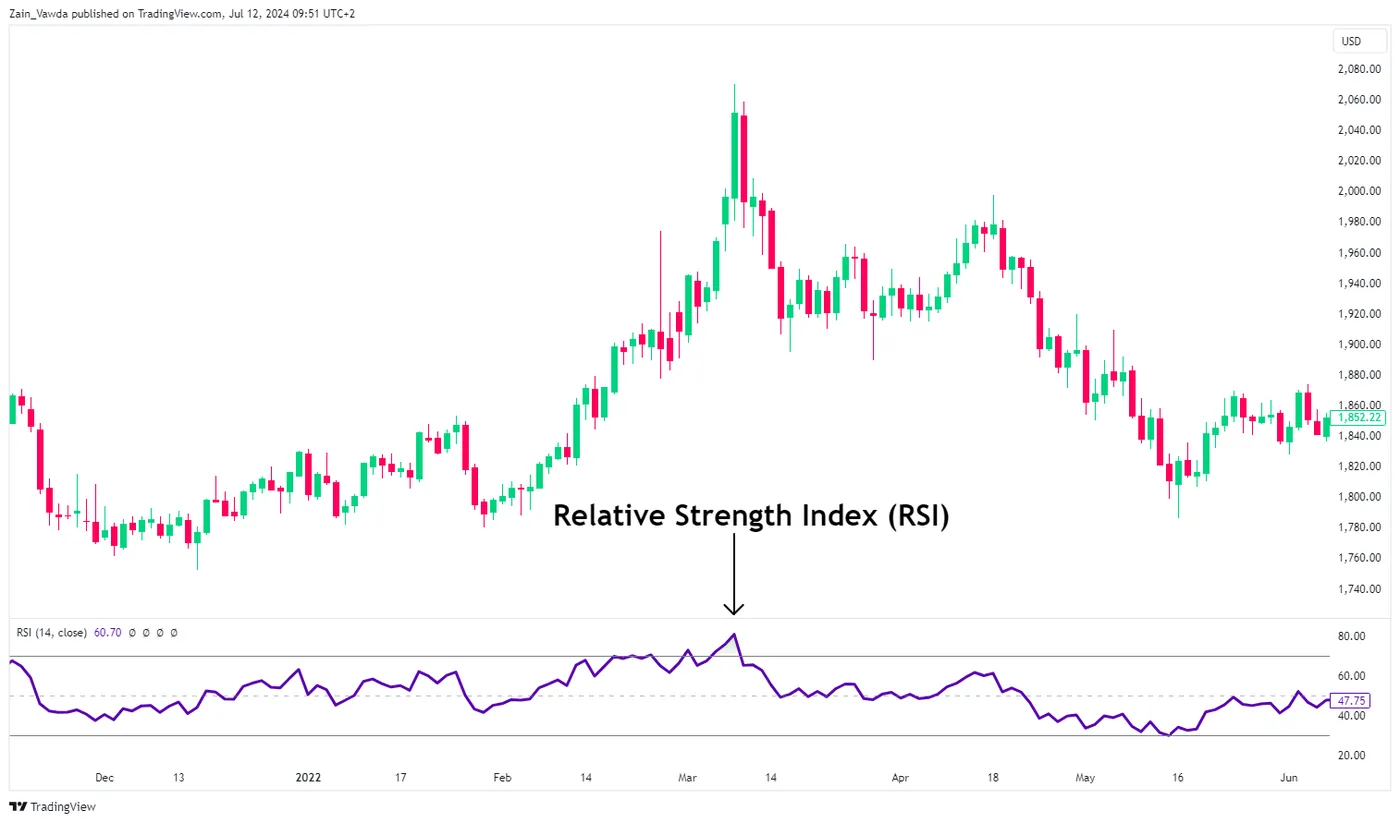
RSI is a technical indicator that gives value on a scale of 0 to 100:
-If RSI > 70, the asset is considered overbought (price may fall).
-If RSI < 30, the asset is considered oversold (price may rise).
This indicator helps traders find entry and exit points. The default setting is 14-period RSI, but many traders customize it to use 9-period RSI—especially for intraday or scalping.
🔸 RSI 14 vs. RSI 9 – Key Differences Explained
| Feature | RSI 14 | RSI 9 |
|---|---|---|
| Time Period | Average of the last 14 candles | Average of the last 9 candles |
| Sensitivity | Low (more stable and smoother signals) | High (faster reaction and quicker moves) |
| Signal Frequency | Fewer but more reliable signals | More signals, but requires quick decisions |
| False Signals | Lower chance (especially in stable markets) | Higher chance (in choppy or volatile markets) |
| Ideal For | Swing or patient intraday traders | Fast scalping or quick intraday traders |
🔸 Backtest Example:
-Stock: Infosys (INFY)
-Timeframe: 5-min chart
-Duration: 5 din ka data
-RSI Version Win Rate Avg. Profit/Trade False Signals
-RSI 14 62% ₹1.10 per trade 3
-RSI 9 70% ₹0.80 per trade 7
📌 Observation:
RSI 9 gave more trades, but the average profit per trade was low.
RSI 14 gave fewer but stable trades—suitable for low-risk traders.
Stop-loss and fast reaction were necessary when using RSI 9.
🔸 Depends on your trading style:
✅ Choose RSI 14 if you:
-Trade intraday with patience
-Prefer fewer and stronger signals
-Take trades with multiple confirmations
✅ Choose RSI 9 if you:
-Do fast scalping (5-min or 1-min charts)
-Can make quick entry-exit
-Have high-risk tolerance
🔸 Depends on your trading style:
✅ Choose RSI 14 if you:
-Trade intraday with patience
-Prefer fewer and stronger signals
-Take trades with multiple confirmations
✅ Choose RSI 9 if you:
-Do fast scalping (5-min or 1-min charts)
-Can make quick entry-exit
-Have high-risk tolerance
🔸 RSI 9 + RSI 14: Combination of both
Many smart traders use both indicators together.
Strategy:
-If RSI 9 crosses below 30 and goes up = BUY signal
-If RSI 14 is showing parallel uptrend = Confirm BUY
-Same logic for SELL (RSI 9 crosses 70 downward, and RSI 14 is flat/down)
-This gives you the advantage of fast entry + also protects from false signals.
🔸 What else to use with RSI?
Taking trade with RSI alone can be risky. You can also use these indicators along with it:
-VWAP (Volume Weighted Average Price): confirms intraday trend
-MACD: gives Momentum and crossover signals
-Support/Resistance zones: to validate RSI signals
🔸 Real-Life Mistake:
A trader took 3 consecutive trades in Reliance using RSI 9. He bought every time when it crossed below 30. But due to market news the stock was continuously falling.
If he had taken support of RSI 14 or MACD, he could have avoided this loss.
Lesson:
Fast signals are good, but confirmation is important!
🔸 Final Verdict: RSI 14 vs RSI 9 – Who Wins?
✅ RSI 14 – Reliable, stable, suitable for calm traders
✅ RSI 9 – Fast, high-frequency signals, suitable for experienced intraday traders
✅ Best Option? – Smart combination of both + backtest on your own strategy
🔸 Conclusion:
RSI is a powerful tool, but no indicator is foolproof. Both RSI 14 and RSI 9 have pros and cons. Success in trading depends on how disciplined you are and how good your risk management is.
📌 Pro Tip: Backtest RSI 9 and RSI 14 on your 2-3 favorite stocks today itself. Use whatever works consistently for you.


Leave a Reply